- Solana (SOL) is trading between $144.50 and $149, with price action stalling at key resistance.
- A breakout above $149 could trigger a move toward $155, while a drop below $144 risks further downside.
Solana (SOL) showed signs of recovery in early trading on May 8, climbing back to $146.50 after briefly dipping below $144.50. The rebound followed a bullish engulfing candle and a break above the 20 and 50 EMAs on lower timeframes. However, SOL’s momentum hit a wall at the $149 resistance — a key level that had already denied bulls on May 7. This zone now acts as a psychological and technical hurdle, capping short-term gains and signaling hesitation among traders.
On the daily chart, SOL remains in a modest uptrend, supported by the 200 EMA around $140.89. But for a stronger bullish signal, Solana needs to break the 23.6% Fibonacci retracement level at $155.43, drawn from the November 2023 high to the March 2024 low.
Also read: Ethereum’s Pectra Upgrade Explained: Bullish Indicators Point to Breakout
Indicators on shorter timeframes offer mixed signals. The RSI on the 15-minute chart dropped toward 40 after peaking above 70, hinting at cooling momentum. The MACD also flipped bearish, while the 4-hour chart shows rejection from trendline resistance. However, the Stochastic RSI is rebounding from oversold territory — a classic setup for consolidation rather than collapse.
Technical indicators like the Keltner Channels and Bollinger Bands are narrowing, signaling volatility compression. This typically precedes a breakout, but solana remains range-bound between $144.50 and $149.30. Unless the price decisively breaks above or below this band, the short-term bias remains neutral.
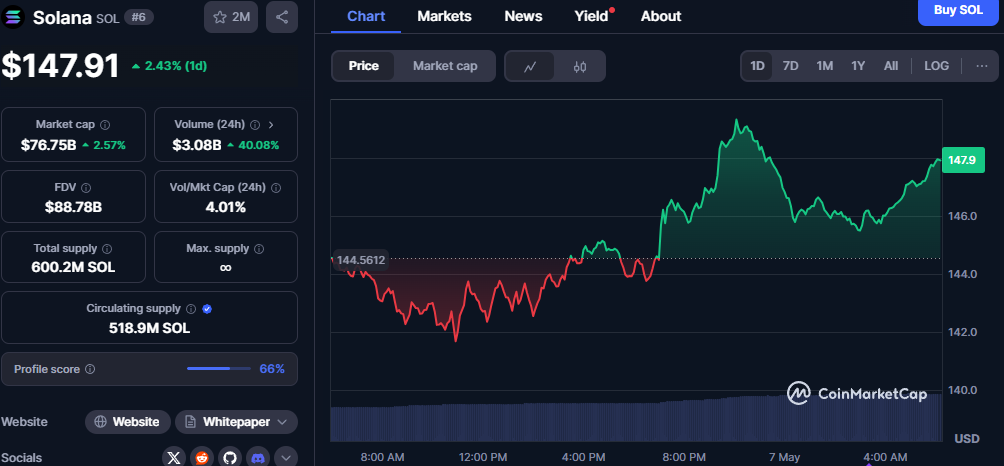
The recent drop from $149.28 was likely caused by profit-taking after SOL rallied from $141.65. Sellers stepped in near a well-established resistance zone, putting a pause on the bullish move. For now, immediate support lies at $144.56 — the confluence of the EMA 100 on the 15-minute chart and the trendline base.
A break below $144 could expose SOL to $141.65 or even $140.89. On the upside, clearing $149 with strong volume may open the door to $155 and potentially the $183 zone in the longer term.
Solana is stuck in a tight range, and the next major move hinges on whether bulls can break through $149. Traders should keep a close eye on this resistance as volatility is poised to expand in the coming days.