XRP’s Chart Echoes Past Glory: A Prelude to Another Historic Surge?

- XRP’s recent chart formation mirrors the pre-2018 bull run pattern, hinting at a possible significant market movement.
- Despite a 9% drop in February, XRP has shown resilience, bouncing back to demonstrate the dynamic nature of cryptocurrency markets.
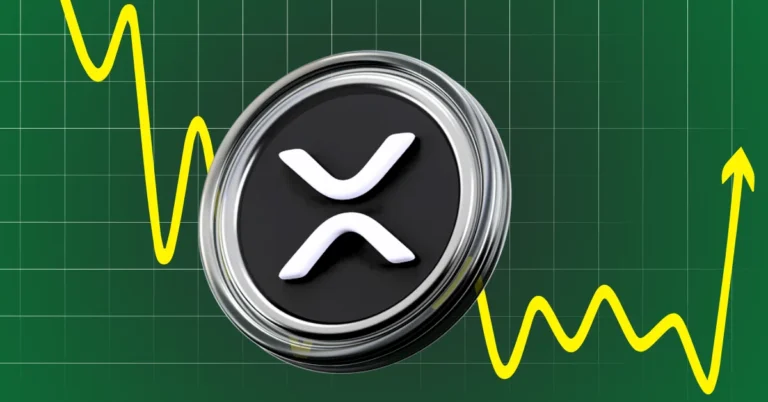
Cryptocurrency markets are renowned for their volatility and the potential for significant gains, a fact underscored by Ripple’s XRP and its recent chart activities. A seasoned market analyst has identified a recurring chart pattern in XRP’s movements, drawing parallels with the formations observed before the colossal bull run of 2018. Such patterns, specifically the symmetrical triangle formation spotted on the XRP three-week chart, serve as a harbinger for potential price escalations, reminiscent of the nearly 66,000% surge XRP experienced between 2017 and 2018.
XRP’s journey has exemplified the rollercoaster nature of cryptocurrency markets. A peak of $0.5795 on February 16 was followed by a significant dip, with the price bottoming out at $0.5252 by February 23. This 9% fall highlighted the asset’s inherent volatility. Yet, in a testament to the market’s resilience, XRP managed to reclaim its position, pushing back into the $0.58 range with a 4.33% rise within 24 hours.
The Echoes of History
The spotlight on this symmetrical triangle is not merely for its aesthetic appeal on the charts but for its historical significance in signaling monumental price movements. The formation, observed before the historic rally that saw XRP’s value skyrocket, is again becoming evident, suggesting the possibility of a repeat performance.
Moonshilla, the analyst shedding light on this pattern, points out the similarities with the period following the November 2013 high. After a series of highs and lows, XRP’s price embarked on a breakout in March 2017, following an unsuccessful attempt in December 2014, culminating in an astonishing surge to over $3 in January 2018.
Currently, XRP appears to be at a critical juncture, sculpting another symmetrical triangle reminiscent of its past. A breakout attempt in 2021 took the token to $1.96, although it couldn’t maintain the momentum, drawing parallels with the 2014 scenario.
As the crypto community watches closely, the potential for another significant market movement looms, underscored by the patterns of the past. Whether history will indeed repeat itself remains to be seen, but the current chart formations provide a compelling narrative for XRP’s future trajectory.

