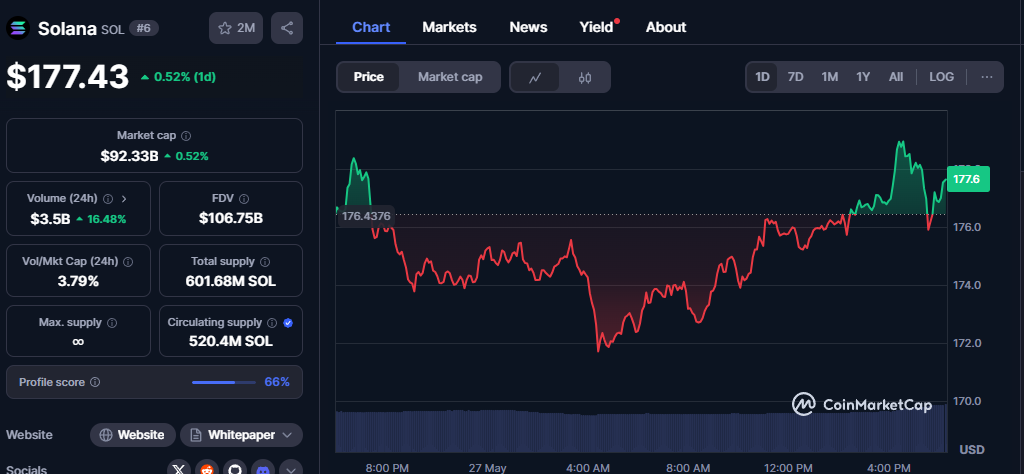
- Solana is consolidating above $165, facing key resistance near $184 that could trigger either a breakout toward $215 or a bearish double top reversal.
- While technical indicators show mixed signals, traders should watch support levels closely amid rising bearish sentiment in derivatives markets.
Solana (SOL) has been holding steady above the crucial $165 level after an impressive 18% rally this month, signaling a period of consolidation that has traders watching closely. This sideways movement, while healthy in the short term, raises the specter of a double top formation—a bearish reversal pattern—around the $184 resistance zone. The big question remains: can the bulls break past this hurdle and push SOL towards the ambitious $215 target?

Technical Landscape Shows Mixed Signals
On the daily chart, Solana is currently trapped in a tight range between the 50% Fibonacci retracement level at $165 and strong resistance near $180-$184. The 50-day and 100-day exponential moving averages (EMAs) have recently crossed bullishly, suggesting potential momentum in favor of buyers. Adding to this, the 200-day EMA near $163 provides solid support, reinforcing the floor beneath SOL’s price.
However, the momentum indicators are still inconclusive. The MACD (Moving Average Convergence Divergence) and its signal line remain closely aligned but have yet to confirm a bullish crossover. This indecision hints at the possibility of a breakdown if sellers gain control, particularly from a falling wedge pattern that traders are closely monitoring.
Also read: SUI Price Holds $3.30 Support — Bulls Eye $6 Target in Upcoming Rally
Upside Potential and Downside Risks
If the bulls manage to break above the key resistance at $184, Fibonacci extensions point to a target near $215, with an even more optimistic projection of $261 in the longer term. Conversely, failure to maintain support above $165 could see SOL testing lower levels, including the 50-day EMA at $158 and the psychologically important $150 mark.
Analyst Perspective and Market Sentiment
Noted crypto analyst Lark Davis highlights a bullish pennant forming on Solana’s daily chart—a pattern that often precedes strong upward moves. If SOL breaks out of this symmetrical triangle, a rally to $200 could be on the cards. Crucial support to watch includes the 20-day EMA at $169 and the 200-day EMA at $163.
Despite these bullish technicals, derivatives data paints a more cautious picture. Open interest has dropped slightly, and the funding rate turned negative, signaling increased bearish pressure in the futures market. Furthermore, a significant number of long positions have been liquidated recently, suggesting some traders are betting against SOL’s near-term upside.
Conclusion
Solana finds itself at a critical juncture. The sideways consolidation above $165 is healthy but comes with the risk of a double top reversal. Bulls need to break through the $184 resistance convincingly to target $215 and beyond. Meanwhile, market sentiment remains mixed, and traders should stay alert to key support levels and signals from both spot and derivatives markets.


