- Solana is currently experiencing a significant surge, pushing towards the critical $160 resistance level amidst strong bullish technical indicators and increasing trading volume.
- A successful breakout above this zone could trigger a substantial rally towards $167 and $176, marking a pivotal moment for the cryptocurrency.
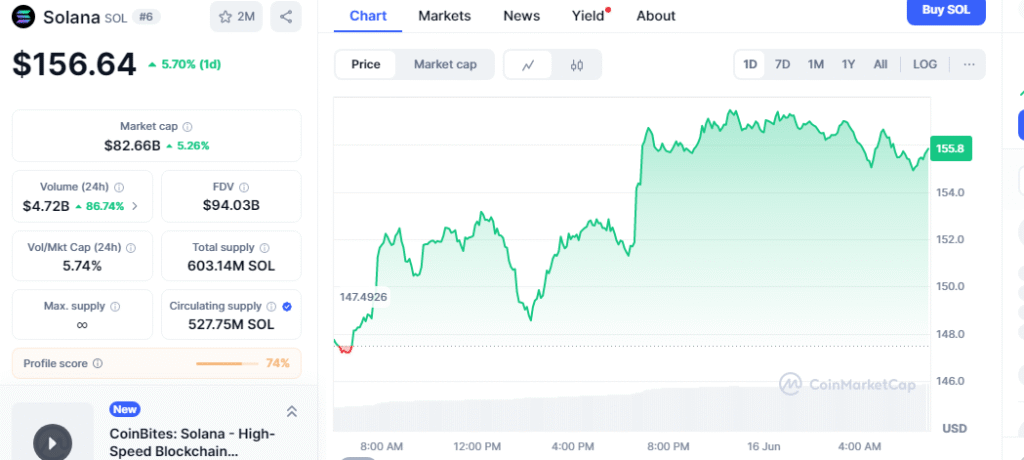
Solana (SOL) is making headlines today as its price extended its recovery, surging to $156.84. This marks a 2.5 percent daily gain, fueled by renewed buying interest after a brief dip below $144 earlier in the week. The cryptocurrency’s recent performance has many analysts and investors keenly watching for what could be a significant breakout.
The current upward trajectory gained substantial momentum following a crucial structure break above $145. This zone, previously a point of contention, has now seemingly transitioned into a strong demand area, signaling a decisive shift in market sentiment that has propelled SOL higher.
Also read Solana Founder Calls Cardano’s $100M Bitcoin Treasury Plan ‘So Dumb’ in Blistering Critiqu
Traders are now focused on the critical price range of $158 to $160. This level represents a formidable resistance zone, and a decisive breach could ignite a powerful rally, potentially pushing Solana towards the $167 and even $176 marks. Historical price data lends further weight to these targets, as they align with an old order block, suggesting a significant area where prior selling pressure emerged.
Technical indicators on the 4-hour chart are largely supportive of the bullish narrative. The Relative Strength Index (RSI) sits at 64.26, indicating robust buying strength just shy of overbought conditions. The Moving Average Convergence Divergence (MACD) has also flashed a clear bullish crossover, while the Chaikin Money Flow (CMF) index, holding at 0.24, reflects a steady influx of capital into SOL.
Trend-following tools further corroborate the positive outlook. The Supertrend indicator remains green, positioned below the current price at $146.85, and Parabolic SAR dots continue to print below price candles, underscoring the prevailing bullish trend.
Adding to the bullish confluence, volatility indicators are showing expansion. Both Keltner Channels and Bollinger Bands have widened, with Solana’s price trading near their upper boundaries. This configuration often precedes aggressive price movements, especially when coupled with strong trading volume. The Volume Profile reinforces this, showing that the $152 to $155 range was reclaimed with conviction and now appears to have flipped from resistance to support.
Smart Money Concepts also paint a bullish picture, with multiple change-of-character patterns and subsequent break-of-structure confirmations invalidating previous bearish setups, particularly those near the $140 level. Directional indicators, including a rising ADX and the +DI line overtaking the -DI line, further point to strengthening trend momentum.
Solana now faces its most significant technical challenge at the $158 to $160 resistance zone. A clean breakout here could pave the way for a continued ascent towards $167 and $176. However, a failure to breach this barrier could lead to a pullback, with immediate support levels identified at $152.71 and $146. All eyes remain on Solana as it approaches this pivotal mark with increasing volume and momentum, anticipating a potentially strong move in the sessions ahead.