SOL Price Revisits November 2024 Lows – A Big Breakout Ahead?
More from the Author Sean Williams
Solana (SOL) is showing signs of a potential breakout after a prolonged correction, with key support at $168.94 and bullish divergence in RSI suggesting weakening selling pressure.
A decisive move above resistance levels at $173.42, $195.81, and $216.90 could confirm an upward trend, while failure to hold support may lead to further downside.
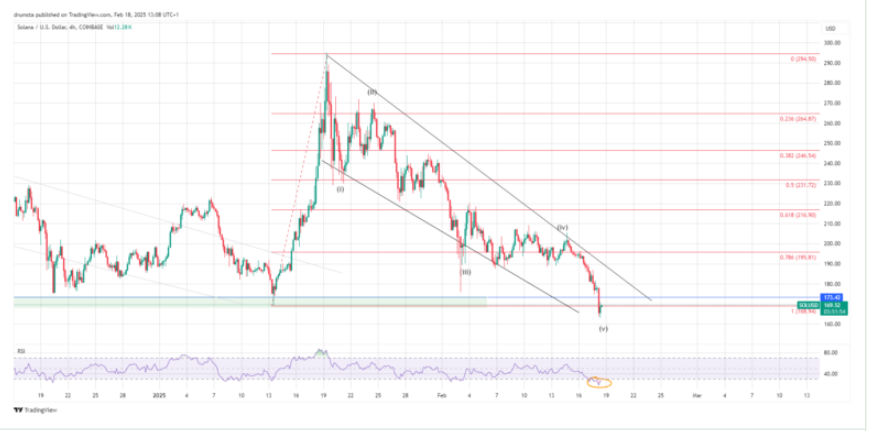
Solana (SOL) has been in a strong corrective phase, tracing a well-defined descending channel while forming a five-wave Elliott Wave structure. However, recent price action suggests that this downturn may be nearing its end. Could SOL be gearing up for a breakout? Let’s analyze the key indicators.
Breaking the Descending Channel
For weeks, SOL has made successive lower highs and lower lows, conforming to a typical descending channel pattern. However, technical signals suggest that this downward trajectory could soon reverse. The asset has reached a key support zone at $168.94, which aligns with the 1.0 Fibonacci extension of the previous corrective wave. A strong bounce from this level may indicate that a shift in trend is underway.
Bullish Divergence in RSI
One of the most promising indicators of a potential price reversal is the Relative Strength Index (RSI). The 4-hour chart reveals that while SOL has been making lower lows, the RSI has been printing higher lows. This bullish divergence suggests that selling pressure is weakening, increasing the likelihood of an upward move.
Key Resistance Levels to Watch
For SOL to confirm a breakout, it must overcome critical resistance zones:
Immediate Resistance: $173.42, corresponding with the descending trendline.
Key Resistance: $195.81, the 0.786 Fibonacci retracement level.
Major Resistance: $216.90, aligning with previous consolidation zones.
A decisive move above these levels would signal the beginning of a new bullish phase.
Potential Price Targets
Looking at the 1-hour chart, SOL appears to be in the early stages of an impulsive wave formation. If wave (ii) holds above $168.94, SOL could gain momentum, with wave (iii) targeting the $180 zone. A successful break above $173.42 would validate the bullish outlook, potentially pushing prices toward the $195.81 level.
In a more extended bullish scenario, wave (v) could propel SOL past $216. However, traders should monitor RSI levels for overbought conditions, which may lead to a pullback before the next rally.
What Happens If Support Fails?
While optimism surrounds a potential breakout, failure to maintain support above $168.94 could signal further downside. In that case, SOL may retest the $160-$165 range before attempting another recovery.
Final Thoughts
Solana is at a pivotal moment, with technical indicators pointing toward a potential breakout. If bullish momentum sustains, SOL could soon reverse its corrective phase and embark on a new upward trajectory. Traders should keep an eye on key resistance levels and RSI momentum to confirm the next move.
The post SOL Price Revisits November 2024 Lows – A Big Breakout Ahead? appeared first on Crypto News Focus.