- Shiba Inu (SHIB) is consolidating near key resistance at $0.00001470, with a potential breakout signaling a move toward $0.00001720.
- However, failure to gain momentum could keep SHIB range-bound between $0.00001280 and $0.00001420.
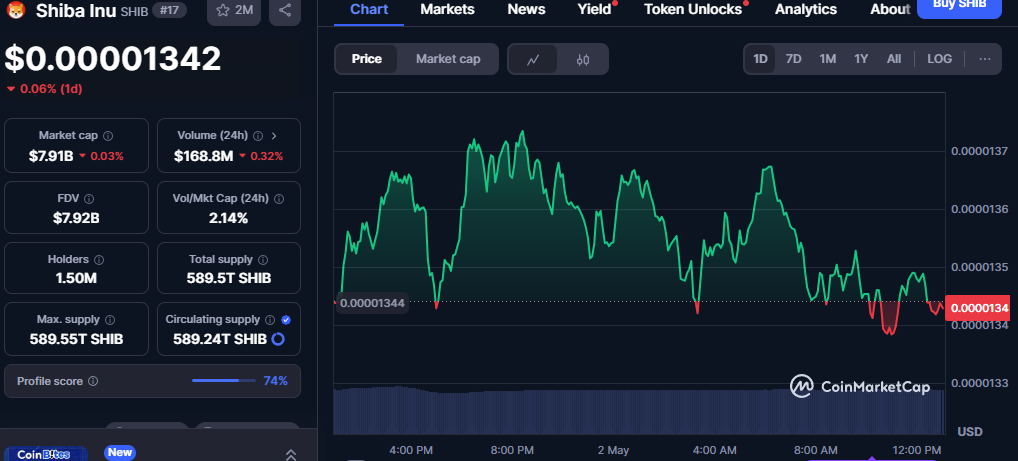
Shiba Inu (SHIB) enters May 2025 on uncertain footing, trading near $0.00001340 after bouncing modestly from April’s lows. As the meme coin consolidates near a key descending resistance line, traders are eyeing whether SHIB will stage a breakout or continue to range in a tight band. Here’s a closer look at the technical signals shaping SHIB’s price path this month.
Weekly Outlook: Battling Fibonacci Resistance
SHIB continues to trade under pressure from the 0.618 Fibonacci retracement level at $0.00001945, a critical resistance that has capped bullish momentum for weeks. A strong weekly close above $0.00001950 could pave the way toward $0.00002212 and even $0.00002478, but failure to hold above $0.00001300 risks a retreat toward the $0.00001100–$0.00001080 zone.
Also read: Ethereum in May 2025: ETF Inflows, DeFi Strength, and the Pectra Upgrade Explained
Daily Chart: Descending Triangle in Focus
On the daily chart, SHIB is pressing against the upper edge of a descending triangle, with resistance looming at $0.00001470. A decisive breakout here could propel SHIB toward $0.00001580 and $0.00001720, invalidating the bearish structure. However, a drop below the $0.00001280 pivot could spark renewed downside pressure.
4-Hour Chart: Wedge Pattern Signals Compression
Zooming in, the 4-hour chart reveals a tightening wedge pattern, with trendlines converging around $0.00001460. The green support cluster between $0.00001280 and $0.00001320 has repeatedly held firm. If SHIB breaks above $0.00001470 with conviction, short-term targets of $0.00001580–$0.00001660 come into play.
Indicators: Neutral Bias with Bullish Hints
- EMA Stack (20/50/100/200): Price is just above the 20 and 50 EMAs, but still below the 100 and 200, suggesting cautious optimism.
- RSI (14): At 48, momentum remains neutral. A break above 55 would indicate building bullish pressure.
- Bollinger Bands: Tightening bands hint at a volatility breakout soon.
- MACD: Flat, but a bullish crossover could ignite upward movement.
All Eyes on $0.00001470
Shiba Inu’s price structure is coiling, and May could be a decisive month. A confirmed breakout above $0.00001470 could trigger a mini-rally, but failure to overcome resistance may leave SHIB trapped in a $0.00001280–$0.00001420 range. Until then, traders should stay alert and watch volume and RSI for clues.