Key Takeaways
- Understanding candlesticks, trends, and support levels is crucial for reading any crypto price chart in 2025–2026.
- Indicators like RSI, moving averages, and volume enhance decision-making without overcomplicating analysis.
- Chart literacy helps investors avoid emotional trading and identify real market opportunities.
How to Read a Crypto Price Chart
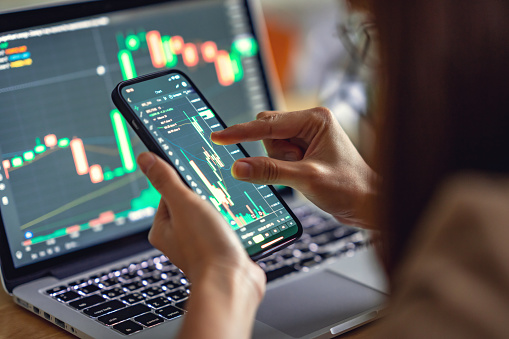
Understanding how to read a crypto price chart has shifted from a niche trading skill to an essential part of navigating the digital economy. As crypto markets enter 2025 and 2026 with higher liquidity, more institutional participation, and growing mainstream adoption, price charts have become richer in data and more important for decision-making. Whether you’re buying Bitcoin for the first time or analyzing altcoin volatility, chart literacy can help you avoid emotional trading and recognize real market signals.
While price charts may look intimidating at first—candles, wicks, colors, and fast-moving numbers—the underlying logic is surprisingly clear. Once you understand what each part represents, the noise settles and patterns emerge. The goal isn’t to predict the future but to read the market’s story in real time.
Why Crypto Price Charts Matter in 2025–2026
The crypto market today behaves more like a hybrid between traditional finance and digital-first speculation. As global regulations solidify and Bitcoin ETFs continue to attract institutional flows, price charts reflect deeper liquidity and more defined market cycles than in the early years of crypto trading. At the same time, meme coins, AI tokens, and emerging blockchain sectors still introduce bursts of volatility.
This duality makes chart reading crucial. A crypto price chart compresses millions of data points—trades, sentiment, liquidity, and market psychology—into a single visual. In an environment influenced by real-time macro events, halving cycles, and stablecoin flows, understanding these visuals becomes a critical edge.
The Candlestick: Your Primary Crypto Market Signal
Candlestick charts remain the most common and effective way to read crypto prices. Each candle provides four essential data points: the opening price, closing price, highest price, and lowest price within a specific timeframe. These timeframes can range from one minute to one month, depending on your trading horizon.
A green candle typically signals upward movement, showing that the closing price was higher than the opening price. A red candle indicates the opposite. The “wicks,” or thin lines extending above and below the body, reveal volatility—how far prices stretched beyond the opening and closing levels.
In 2025 and 2026, with crypto markets trading nearly 24/7 across global platforms, candlestick patterns are particularly useful for spotting shifts in momentum. Patterns such as engulfing candles, doji formations, and hammer shapes often act as early signs of reversals or trend exhaustion. While no pattern guarantees a move, these clues help traders stay grounded in market logic rather than emotion.
Trendlines, Support, and Resistance: The Framework of Market Behavior
Once you understand individual candles, the next step is capturing the broader trend. Trendlines help identify whether the market is moving upward, downward, or sideways. An uptrend forms when price consistently creates higher lows; a downtrend forms when price creates lower highs.
Support and resistance zones are equally critical. Support represents price levels where buyers typically step in, slowing or reversing downward moves. Resistance is where upward momentum often weakens as sellers appear. These zones act like the psychological boundaries of the market.
By 2025, AI-driven trading bots and institutional algorithms reinforce these levels more consistently than early crypto markets. As a result, support and resistance patterns often repeat with greater predictability, especially on high-liquidity assets like Bitcoin, Ethereum, and tokenized assets with regulated exchange presence.
Reading these structures on a chart helps traders anticipate potential breakouts or breakdowns. When price breaks a major resistance in strong volume, it often signals a continuation of momentum. Conversely, losing a long-held support level may signal a deeper market correction.
Market Indicators: Extra Insight Without Overcomplicating the Chart
Technical indicators are tools layered onto charts to help interpret trends. The most widely used indicators in crypto trading—Moving Averages, RSI, MACD, and Volume profiles—offer context behind price moves. However, the key in 2025–2026 is not using more indicators, but using the right ones with restraint.
Moving Averages (MA), particularly the 50-day and 200-day lines, help traders understand long-term growth or weakness. When the 50-day MA crosses above the 200-day MA, it forms the “Golden Cross,” often signaling long-term bullishness. The opposite—known as the “Death Cross”—can warn of a deeper downturn.
The Relative Strength Index (RSI) helps identify overbought or oversold conditions. If RSI stretches above 70, the asset may be overheated; below 30, it may be undervalued. This is especially useful during volatile altcoin seasons when price reacts rapidly to social sentiment.
Volume indicators show whether a price move is backed by strength. In today’s market, with institutional players driving large portions of trading volume, high-volume breakouts are often more reliable.
The secret is balance—indicators should clarify, not clutter, your reading of market behavior.
Putting It All Together: Reading Crypto Charts in a Mature Market
As crypto markets mature through 2025 and 2026, price charts increasingly resemble those in traditional finance, but with the unique speed and unpredictability that define digital assets. Reading a chart is not about predicting every move—it’s about recognizing the conditions that shape the market’s direction.
A candle tells you what happened in a chosen timeframe. A trendline tells you the market’s broader direction. A support or resistance level shows the boundaries of trader psychology. Indicators add actionable context. Together, they reveal the underlying narrative.
For investors and traders alike, chart literacy provides structure in a fast-moving environment. Whether you’re managing long-term positions or reacting to intraday momentum, knowing how to read a crypto price chart empowers you to make informed decisions grounded in data—not hype.
Conclusion
In 2025 and 2026, learning how to read a crypto price chart is not just a trading skill—it’s a form of financial literacy. As digital assets continue moving closer to the mainstream economy, understanding price action helps you navigate uncertainty with clarity. When you can interpret trends, resist emotional reactions, and recognize meaningful signals, the market becomes less of a gamble and more of a strategic environment.
The crypto world rewards informed decisions. Mastering chart reading is one of the most reliable ways to build that foundation.