3 Key Takeaways:
- Master the basics of candlesticks, trends, and trading volume.
- Learn how to identify support, resistance, and market momentum.
- Gain confidence in making informed crypto trading decisions.
How to Read a Crypto Price Chart: A Beginner’s Guide to Smarter Trading in 2025
In 2025, the crypto market has matured — but volatility remains its defining trait. Whether you’re investing in Bitcoin, Ethereum, or new altcoins, understanding how to read a crypto price chart is one of the most important skills a trader can develop. Charts reveal the psychology of the market — showing when fear, greed, or stability dominate.
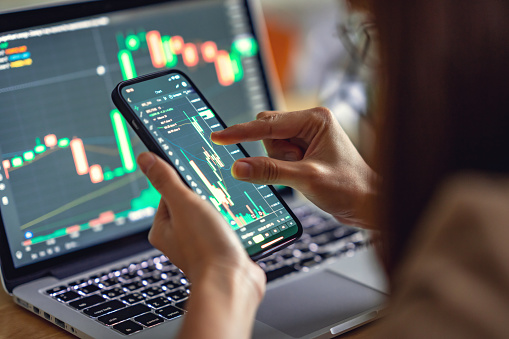
If you’ve ever stared at a chart filled with colorful candles and mysterious lines, this guide breaks it down into simple, actionable insights.
Understanding the Basics of a Crypto Chart
At its core, a crypto price chart visualizes how a cryptocurrency’s value changes over time. The most common chart used by traders is the candlestick chart, which originated from Japanese rice traders centuries ago and is now the industry standard in finance.
Each candlestick represents price movement over a specific time frame — from one minute to one week or more.
A candlestick shows four main values:
- Open: The price when the time period began.
- Close: The price when the time period ended.
- High: The highest price reached during the period.
- Low: The lowest price reached during the period.
A green (or white) candle means the price closed higher than it opened (bullish), while a red (or black) candle means it closed lower (bearish).
These small details form the foundation of chart reading and help traders spot patterns, trends, and potential reversals.
Spotting Trends: The Market’s Direction
In crypto trading, the trend is your friend. Recognizing the direction of a trend helps determine when to enter or exit a position.
There are three primary types of market trends:
- Uptrend (Bullish): Prices consistently make higher highs and higher lows. Traders often buy during dips in an uptrend.
- Downtrend (Bearish): Prices make lower highs and lower lows. Traders may sell or short assets to profit from declines.
- Sideways (Consolidation): Prices move within a narrow range, signaling indecision before a breakout.
Using trendlines — diagonal lines drawn along highs or lows — helps visualize these directions. In 2025, modern trading tools like TradingView make identifying and tracking trends easier than ever, with automated pattern recognition and AI-based predictions.
Reading Support and Resistance Levels
Support and resistance levels are essential for understanding how traders think.
- Support: A price level where demand is strong enough to prevent the price from falling further.
- Resistance: A price level where selling pressure prevents the price from rising.
For example, if Bitcoin repeatedly bounces back from $60,000, that level becomes strong support. If it struggles to break $70,000, that’s resistance.
Once resistance is broken, it often becomes new support — a sign of shifting market psychology. Recognizing these zones helps traders set stop-loss and take-profit levels more effectively.
The Role of Volume: Confirming Market Moves
Volume refers to how many coins or tokens are traded during a certain period. It confirms the strength of a price movement.
- High volume indicates strong interest and confirms a trend’s strength.
- Low volume suggests weak conviction or potential reversal.
In 2025’s crypto landscape, many exchanges now include on-chain volume analysis, helping traders distinguish between real and artificial market activity
Common Chart Patterns Every Trader Should Know
Patterns are recurring formations that signal potential price moves. Recognizing them can give traders an edge.
Here are a few of the most popular:
- Head and Shoulders: Signals a potential reversal from an uptrend to a downtrend.
- Double Bottom: Indicates strong support and a possible bullish reversal.
- Ascending Triangle: Suggests a breakout toward higher prices.
- Descending Triangle: Hints at a downward breakout.
While no pattern guarantees results, combining pattern recognition with volume and momentum indicators improves accuracy.
Key Indicators to Enhance Chart Reading
Beyond basic price movement, traders often use technical indicators to confirm trends and predict future moves.
Some of the most widely used include:
- Moving Averages (MA): Smooth out price data to identify long-term trends.
- Relative Strength Index (RSI): Measures whether an asset is overbought or oversold.
- MACD (Moving Average Convergence Divergence): Tracks momentum and trend reversals.
- Bollinger Bands: Show volatility and potential breakout zones.
In 2025, many crypto platforms now integrate AI-driven analysis tools that automatically interpret these indicators, giving users insights once reserved for professionals.
Practical Tips for Beginners
- Start with larger time frames (like daily or weekly) before analyzing short-term charts.
- Combine multiple indicators for confirmation — don’t rely on just one signal.
- Avoid emotional trading — let the charts guide your decisions, not fear or greed.
- Backtest strategies using past data to see how they perform before committing real funds.
- Stay updated — global news, regulation, and technology shifts can heavily influence charts.
Why Chart Reading Matters in 2025
Crypto markets are faster and more data-driven than ever. With institutional investors, DeFi, and AI-based trading shaping market behavior, the ability to read and interpret charts separates informed traders from speculators.
Whether you’re day trading altcoins or holding long-term positions, understanding chart patterns, volume, and indicators helps you predict trends, minimize risk, and maximize profit.
Final Thoughts
Learning how to read a crypto price chart is more than just analyzing lines and candles — it’s about understanding human behavior, market psychology, and data. In 2025, successful traders combine technical knowledge with patience and discipline.
By mastering charts, you gain the confidence to navigate volatile markets, spot early opportunities, and build a sustainable crypto strategy for 2026 and beyond.