Ethereum’s 20% Rebound: Recovery or the Start of a Bigger Crash?

More from the Author Cal Evans
Ethereum (ETH) recently crashed 35% before rebounding 20%, but technical indicators remain bearish, suggesting the potential for further declines if it breaks below $2,125.
While a bullish scenario could push ETH to new highs, failure to hold support may signal the start of a prolonged bear market.
Ethereum (ETH) has experienced a rollercoaster ride in recent months, leaving investors and analysts divided on its future trajectory. After a dramatic 35% plunge in just three days, ETH found itself at a critical juncture, barely clinging to its long-term support trend line. However, a 20% bounce from its recent low of $2,125 has sparked renewed debate. Is this a sign of recovery, or is the worst yet to come?
Ethereum’s Struggle at Resistance Levels
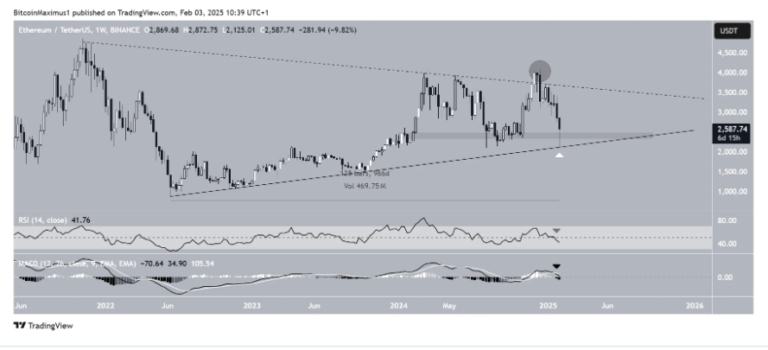
Despite being the second-largest cryptocurrency, Ethereum has struggled to break past the psychological barrier of $4,000. December 2024 saw a promising rally that many believed would lead to new all-time highs, but the momentum fizzled, leading to a steep decline of nearly 40%.
On February 3rd, ETH hit a low of $2,125, marking its lowest point since June. However, a critical bounce from an ascending support trend line, which has been intact for 966 days, provided some temporary relief. ETH also validated the $2,450 horizontal support area, giving traders hope for a potential reversal.
Bearish Indicators Cast a Shadow
While the recent rebound is encouraging, technical indicators paint a different picture. The Relative Strength Index (RSI) has dipped below 50, signaling weakening momentum, while the Moving Average Convergence/Divergence (MACD) has made a bearish cross. These indicators suggest that the recent bounce may not be sustainable and that further declines could be on the horizon.
Adding to the bearish case, Ethereum recently broke down from a descending parallel channel, a structure that typically indicates the start of an impulsive decline rather than a corrective pullback. Moreover, ETH’s failure to reclaim the channel’s support trend line raises concerns about its ability to sustain any upward momentum.
What’s Next for Ethereum?
From an Elliott Wave perspective, there is still one remaining bullish scenario: ETH may have just completed wave four in a five-wave structure that began in 2018. If this count holds, ETH could still target a new all-time high of around $7,331. However, this wave structure appears unusual, making it less reliable.
The bearish outlook suggests that a breakdown below $2,125 would confirm the end of the current bullish cycle, signaling the beginning of a prolonged bear market. Some analysts predict that ETH could drop as low as $730 if the bearish structure plays out.
Final Thoughts
Ethereum’s recent price action has left investors in a state of uncertainty. While the 20% rebound provides hope, bearish indicators and structural breakdowns suggest caution. If ETH fails to hold above its key support levels, the bullish cycle may be over, giving way to a deeper decline. Traders should watch $2,125 closely, as a break below this level could confirm the onset of a new bearish phase.
The post Ethereum’s 20% Rebound: Recovery or the Start of a Bigger Crash? appeared first on Crypto News Focus.