
- Ethena is approaching the $0.36 resistance level, with signs of a potential correction due to a short-term bearish divergence.
- If the rally continues, breaking this resistance could lead to further gains, but a minor dip might precede any breakout.
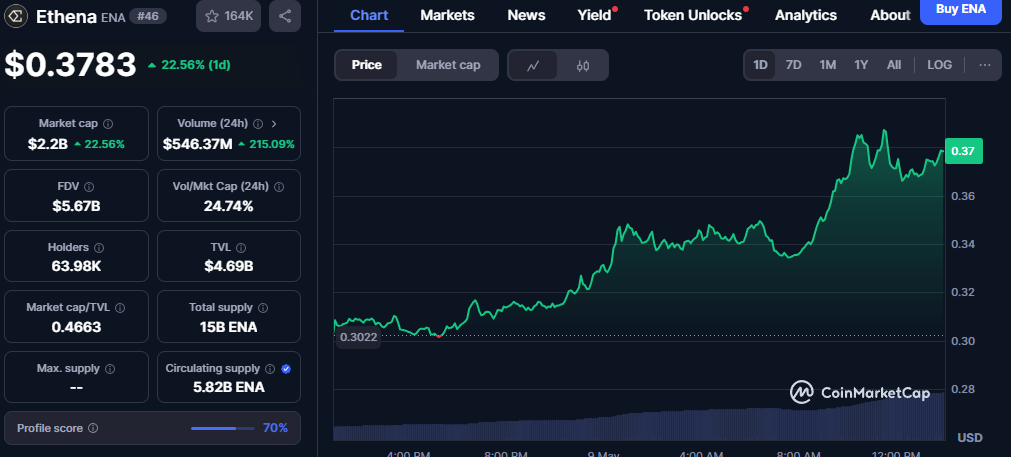
Ethena (ENA) has been on an impressive upward trajectory, surging 27% in just a single day amid Bitcoin’s surge past $100K. However, as the price nears the $0.36 resistance level, questions are beginning to surface: will the rally continue, or is a correction on the horizon?
Ethena has been trading within a descending channel since March, but recent market movements suggest a potential breakout. On the 1-day chart, indicators such as the On-Balance Volume (OBV) and the Money Flow Index (MFI) have shown signs of recovery after a brief downturn. The OBV, in particular, picked up during the 24-hour surge, signaling increasing buying pressure, while the MFI showed a similar uptic
Also read: Cardano Price Prediction: Will ADA Hit $0.80 as Bullish Momentum Builds?
Yet, despite these positive signs, a short-term bearish divergence between price action and the MFI on the 1-hour chart suggests a possible dip. Such a correction could take ENA down to support levels around $0.318 or $0.313 before the upward momentum picks up again.
The key resistance zone to watch lies between $0.355 and $0.365, a level that coincides with the upper bounds of the current descending channel. Traders may look to take profits around the $0.36 mark, especially since it aligns with previous channel highs. However, if ENA can sustain its recent momentum and break through this resistance, a breakout could be on the cards.
Furthermore, liquidation heatmap data shows significant liquidity clusters above, particularly around $0.343, with $0.36 acting as a magnetic price level. If these levels are tested and surpassed, ENA could potentially move higher, but caution remains warranted.
In conclusion, while Ethena has shown strong potential, a correction could still occur, particularly in the short-term. Investors should keep a close eye on both technical indicators a