
- Dogecoin and Shiba Inu prices are showing bearish signs, with negative funding rates and weakening technical indicators suggesting further declines.
- DOGE could drop to $0.157 and SHIB to $0.000011 if resistance levels aren’t broken soon.
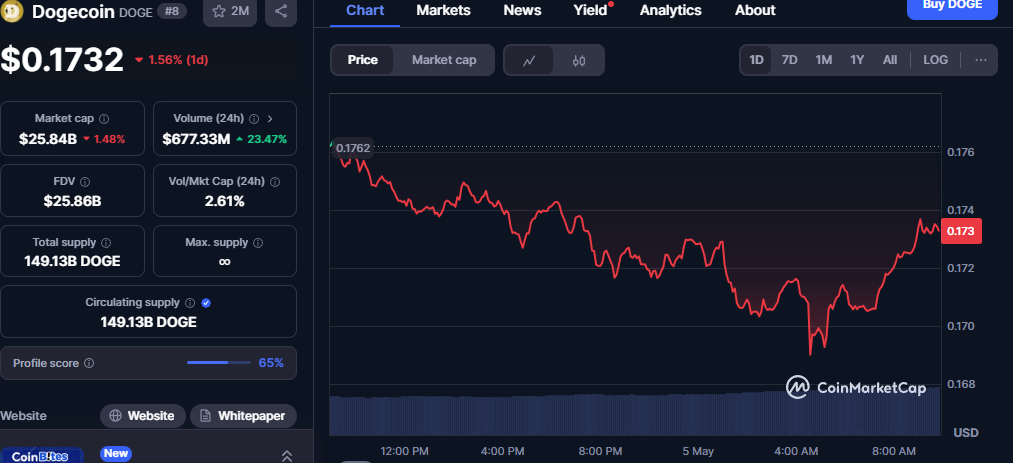
Dog-themed cryptocurrencies Dogecoin (DOGE) and Shiba Inu (SHIB) are flashing clear bearish signals as traders turn increasingly pessimistic. On Monday, DOGE traded around $0.172 and SHIB at $0.000012, both down nearly 5% from the previous week. Several indicators now point to a deeper correction, with targets at $0.157 for DOGE and $0.000011 for SHIB.
One major red flag is the negative funding rates for both meme coins, a sign that more traders are betting on price declines. According to Coinglass data, DOGE and SHIB show OI-weighted funding rates of -0.0012% and -0.0055%, respectively. These rates suggest that short positions are dominating the futures markets, often a precursor to downward price action.
Also read: Litecoin ETF Gains Momentum: SEC Decision Looms as Price Eyes $100 Mark
Further adding to the bearish case is DOGE’s declining network activity. Data from Santiment shows Dogecoin’s Daily Active Addresses have been falling steadily since mid-March, dropping to 53,000 on Monday. This suggests weakening demand and reduced interest in the Dogecoin network—typically a bearish sign for price momentum.
SHIB isn’t faring much better. Santiment’s Age Consumed metric indicates a spike in previously dormant SHIB tokens being moved—often a sign that long-term holders are preparing to sell. Historically, such spikes have preceded price drops, and with SHIB’s indicator showing its highest spike since late March, the market may be bracing for another leg down.
From a technical standpoint, DOGE is facing stiff resistance at $0.181, a level that aligns with its 50-day Exponential Moving Average. Unless bulls manage to reclaim this zone, a dip to $0.157 appears likely. Similarly, SHIB has failed to break above a descending trendline resistance at $0.000014, coinciding with its 100-day EMA. A breakdown below $0.000012 could open the door to a further slide to $0.000011.
Unless key resistance levels are broken soon, both meme coins look set to continue their decline. Traders and investors should remain cautious, especially with momentum indicators like RSI and MACD showing growing bearish divergence.