Key Takeaways
- Learning to read crypto price charts helps investors track trends, spot opportunities, and manage risk.
- Candlestick charts, trading volume, and moving averages are the most useful tools for analyzing price movements.
- Combining chart analysis with market news and blockchain data gives a fuller picture of potential price action.
Introduction
Navigating the 24/7 cryptocurrency market requires understanding price charts, which visually represent supply, demand, and market sentiment. For beginners and seasoned traders alike, reading charts is essential to make informed decisions, identify trends, and spot potential reversals.
This guide explains how to read a crypto price chart, breaking down chart types, key elements, indicators, and practical tips to help you analyze price movements confidently in 2025.
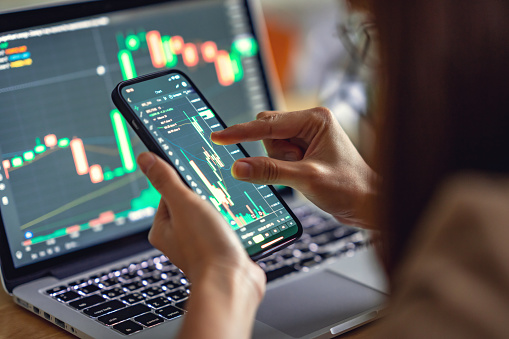
Types of Crypto Price Charts
There are several chart types you’ll encounter:
1. Line Charts
- Shows closing prices over time, connected as a line.
- Simplest chart type, ideal for spotting overall trends.
2. Candlestick Charts
- Most popular for crypto trading.
- Each candlestick shows open, high, low, and close prices over a time period.
- Colors indicate market direction: green for bullish, red for bearish.
- Candlestick patterns provide insight into market psychology and potential reversals.
3. Bar Charts
- Similar to candlesticks but visually different.
- Each bar represents price movement during a period, showing the same four data points.
- Preferred by some traders for detailed technical analysis.
Key Elements of a Crypto Price Chart
Understanding the components of a chart is crucial:
- Price Axis (Vertical): Displays the value of the asset.
- Time Axis (Horizontal): Shows the selected time frame (minutes, hours, days).
- Volume Bars: Indicate trading activity. High volume confirms strong moves; low volume may indicate weak trends.
- Trend Lines: Help identify support (price floor) and resistance (price ceiling) levels.
- Indicators: Tools like moving averages, RSI, and Bollinger Bands provide additional context for analysis.
How to Read Candlestick Patterns
Candlestick charts are valuable because they reveal market sentiment:
- Bullish Candle: Closing price higher than opening (green).
- Bearish Candle: Closing price lower than opening (red).
- Doji Candle: Open and close prices are almost equal, showing indecision.
- Hammer/Inverted Hammer: Possible reversal signals after downtrends.
- Engulfing Patterns: Indicate potential trend continuation or reversal.
By recognizing these patterns, traders can anticipate shifts in buying or selling pressure.
Using Technical Indicators
Technical indicators give more depth to price analysis:
1. Moving Averages (MA)
- Smooth out price data over a chosen period.
- SMA (Simple Moving Average) and EMA (Exponential Moving Average) help identify trends and potential buy/sell points.
2. Relative Strength Index (RSI)
- Measures overbought or oversold conditions.
- RSI above 70 may indicate overbought; below 30 may indicate oversold.
3. Bollinger Bands
- Show volatility by creating upper and lower bands around the price.
- Price touching the bands may indicate potential reversals.
Tips for Beginners
- Start with longer timeframes to understand overall trends.
- Combine multiple indicators for confirmation.
- Watch trading volume alongside price for stronger signals.
- Avoid emotional trading—stick to patterns and data.
- Practice on demo accounts before using real funds.
Why Reading Crypto Price Charts Matters in 2025
As crypto markets grow, price charts remain critical for decision-making. They allow both short-term traders and long-term investors to identify accumulation zones, momentum shifts, and market sentiment. When combined with news, blockchain analytics, and fundamental research, chart reading becomes a powerful tool for navigating volatile markets.
Conclusion
Reading crypto price charts is essential for anyone involved in digital assets. Candlestick patterns, trend lines, volume, and technical indicators reveal market behavior and potential opportunities. With practice, beginners can confidently interpret charts and make informed trading or investment decisions in 2025.