Key takeaways
- Candlesticks reveal market sentiment and trend direction.
- Support, resistance, and volume are the core elements of chart analysis.
- Indicators like RSI and EMAs strengthen decision-making in 2025–2026 markets.
How to Read a Crypto Price Chart
A 2025–2026 Guide to Understanding Trends, Patterns, and Market Signals
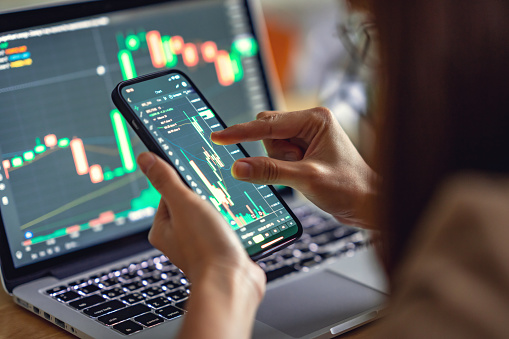
Crypto markets never sleep, and in 2025–2026, price movements have become faster, more volatile, and increasingly influenced by global events, institutional flows, and algorithmic trading. For newcomers and experienced investors alike, learning how to read a crypto price chart is one of the most valuable skills for navigating this dynamic environment.
Price charts aren’t just visual history—they’re real-time narratives of market psychology. Understanding them can help you identify opportunities early, avoid emotional decisions, and stay ahead during both bull and bear cycles.
Why Reading a Crypto Price Chart Matters More Than Ever
The rise of spot ETFs, global regulations, and AI-driven trading systems has made the crypto market more sophisticated. As a result, price movements are no longer purely speculative. They reflect liquidity patterns, investor sentiment, and macro trends more clearly than in earlier cycles.
In 2025–2026, successful traders rely on chart literacy to interpret:
- Market direction
- Momentum shifts
- Volatility cycles
- Entry and exit points
Whether watching Bitcoin, altcoins, or emerging real-world asset tokens, chart analysis remains the backbone of smart decision-making.
Candlestick Basics: The Foundation of Every Crypto Chart
The most common way to visualize price action today is through candlestick charts, which reveal four key data points for any selected timeframe:
- Open — the first traded price
- Close — the last traded price
- High — the peak during the timeframe
- Low — the lowest price reached
Each candlestick tells a small story. A green candle shows upward momentum; a red candle reflects selling pressure. But the real insights come from the shapes and patterns that form over time.
Bullish Signals to Recognize
- Strong green candles after consolidation
- Long lower wicks showing buyers stepping in
- Breakouts above resistance
Bearish Signals to Notice
- Consecutive red candles
- Long upper wicks indicating rejection
- Breakdowns below support
In 2025, these patterns have been integrated into advanced charting tools, but understanding them manually remains essential for accuracy.
Support, Resistance, and Trend Lines: Your Market Compass
Every crypto chart has invisible “pressure points” where price reacts predictably:
- Support is where buyers consistently step in.
- Resistance is where sellers take control.
These levels form naturally through repeated price interaction. In 2026’s more data-driven market, recognizing these zones helps traders confirm whether a move is real or just noise.
Trend Lines
Connecting higher lows gives you an uptrend; connecting lower highs reveals a downtrend. Trend lines help you read market structure and answer the question every trader asks:
Is the market gaining strength or losing it?
A strong trend is usually respected multiple times before breaking, offering reliable signals for entries and exits.
Volume: The Most Underrated Indicator
Volume exposes the strength behind every price movement. Many traders focus on candles but ignore the volume bars beneath them.
In 2025–2026, volume matters even more due to:
- Automated market makers (AMMs)
- Institutional inflows
- Multi-chain liquidity migration
- High-frequency trading bots
A price breakout with high volume signals real momentum. A breakout with low volume is often a trap.
Similarly, declining volume during uptrends or downtrends can hint at reversal points.
Moving Averages and Indicators: Tools to Strengthen Your Analysis
While price action and volume are essential, indicators provide deeper context. The most widely used tools in 2025–2026 remain effective because they filter noise and highlight trends.
Simple Moving Average (SMA)
Smooths price data over a period (e.g., 50 or 200 days).
- Price above the SMA often signals bullish momentum.
- Price below it shows weakness.
Exponential Moving Average (EMA)
More responsive than SMA—favored by short-term traders.
Crossovers, such as the 50 EMA crossing above the 200 EMA, frequently mark trend shifts.
Relative Strength Index (RSI)
Measures momentum.
- Above 70 = potential overbought conditions.
- Below 30 = potential oversold conditions.
MACD
Shows trend strength and direction using moving averages.
MACD crosses in 2026 remain a widely trusted confirmation tool.
Indicators shouldn’t be used in isolation; they add clarity when combined with support/resistance and volume analysis.
Market Structure: The Story Behind the Chart
Beyond indicators, traders must understand market structure, which reveals buyer and seller dominance. Key structures to watch include:
- Higher highs & higher lows — strength
- Lower highs & lower lows — weakness
- Consolidation zones — indecision or accumulation
- Breakouts & breakdowns — shifts in momentum
In 2025, AI-assisted charting tools highlight these structures automatically, but manual reading still helps traders avoid false signals.
The Psychology Behind the Patterns
A crucial part of reading crypto charts is recognizing market emotion. Even in a data-heavy environment, fear and greed remain dominant drivers.
Common emotional phases visible on charts include:
- FOMO-driven spikes
- Panic sell-offs
- Relief rallies
- Slow accumulation
The ability to identify these psychological patterns early is often what separates profitable traders from reactive ones.
Conclusion: Chart Reading Is a Skill That Pays Off
Learning how to read a crypto price chart in 2025–2026 is essential for making informed decisions in an increasingly fast-moving market. Candlesticks, support and resistance levels, volume, trend lines, and indicators all work together to reveal the story behind the price. The more familiar you become with these elements, the more confident and strategic your trading becomes.
Whether you’re a long-term investor, an active trader, or simply exploring crypto, chart literacy is one of the most powerful tools you can develop.