Key Takeaways:
- Crypto charts visualize price movements, trends, and market sentiment.
- Candlesticks, volume, and indicators reveal key buying and selling signals.
- Reading charts effectively helps traders make informed decisions and manage risk.
How to Read a Crypto Price Chart in 2025: A Beginner’s Guide
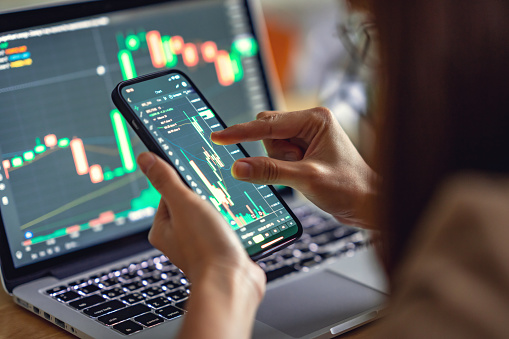
As cryptocurrencies become more mainstream in 2025, understanding how to read a crypto price chart is essential for investors and traders alike. Price charts are the most common tool for tracking digital assets like Bitcoin, Ethereum, and emerging altcoins. Mastering chart analysis helps you make informed decisions, spot trends, and manage risk in the volatile crypto market.
What a Crypto Price Chart Shows
A crypto price chart is a graphical representation of an asset’s price over time. It shows how the market values a cryptocurrency at different points, helping traders identify trends, patterns, and potential entry or exit points. Key components include:
- Price axis (Y-axis): Shows the cryptocurrency’s value in USD or another trading pair.
- Time axis (X-axis): Tracks the duration—minutes, hours, days, or months.
- Volume: Displays the number of coins traded, indicating market interest.
By 2025, most platforms like CoinMarketCap, TradingView, and Binance offer interactive charts with advanced analytics, enabling users to customize views and apply technical indicators.
Understanding Candlestick Charts
Candlestick charts are the most popular type for crypto traders. Each candlestick shows price movement for a specific period and consists of:
- Body: The rectangle indicates the opening and closing price. A green body means the closing price is higher than the opening, while red means the opposite.
- Wicks (Shadows): The lines above and below the body represent the highest and lowest prices during that period.
- Patterns: Multiple candlesticks together form patterns that can signal potential trend reversals or continuation.
For beginners, focusing on simple patterns like doji, hammer, and bullish/bearish engulfing can help identify market sentiment.
Key Indicators to Watch
Beyond candlesticks, several technical indicators help interpret crypto charts:
- Moving Averages (MA): Show average prices over a set period, smoothing out short-term fluctuations.
- Relative Strength Index (RSI): Measures overbought or oversold conditions, indicating potential trend reversals.
- Support and Resistance Levels: Horizontal lines marking price points where the asset tends to find support (buying pressure) or resistance (selling pressure).
By 2025, many trading platforms offer AI-driven indicators that automatically highlight key trends and anomalies, helping even beginners understand market dynamics more quickly.
Tips for Reading Crypto Charts Effectively
- Start with longer timeframes: Daily or weekly charts provide a clearer view of overall trends, reducing noise from short-term fluctuations.
- Combine indicators: No single metric tells the whole story. Use candlesticks, volume, and RSI together for a more accurate picture.
- Stay updated on news: Market sentiment is heavily influenced by events, regulation changes, and adoption news. Chart patterns should be interpreted in context.
- Practice risk management: Even accurate chart reading cannot eliminate volatility. Always set stop-losses and diversify your investments.
Conclusion
Reading a crypto price chart in 2025 is an essential skill for anyone involved in digital assets. By understanding candlesticks, volume, and key indicators, you can interpret market trends and make smarter trading decisions. While charts provide insights, combining technical analysis with awareness of market news and proper risk management is crucial for success in the fast-paced cryptocurrency landscape. With consistent practice, reading charts becomes an intuitive part of your trading strategy, helping you navigate the evolving Web3 market with confidence.