Key Takeaways
- Understanding candlestick patterns and timeframes is essential to reading crypto charts effectively in 2025.
- Technical indicators like RSI, MACD, and volume reveal hidden market momentum.
- Combining technical and fundamental analysis improves trading accuracy and reduces risk.
How to Read a Crypto Price Chart in 2025: Mastering Market Trends and Timing
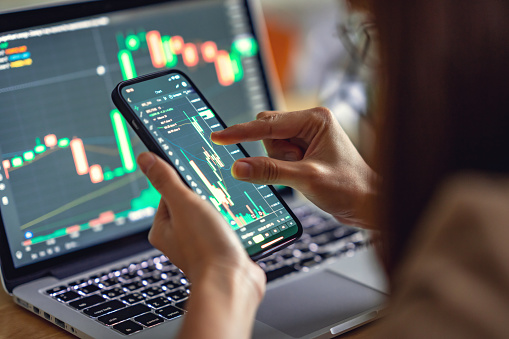
In the fast-evolving world of digital assets, 2025 has ushered in an era of precision trading powered by advanced analytics and AI-driven insights. Whether you’re an experienced trader or a crypto newcomer, one timeless skill remains the cornerstone of success: knowing how to read a crypto price chart.
Crypto price charts tell the story of market psychology — fear, greed, and everything in between — encoded in candlesticks, lines, and bars. But understanding that story requires more than just glancing at a price trend. It’s about learning how to decode momentum, identify reversals, and anticipate moves before they happen.
This guide breaks down how to read crypto charts effectively in 2025 and 2026, highlighting key tools, chart patterns, and modern strategies that can help you stay ahead of the curve.
Understanding the Basics: Price, Time, and Volume
Every crypto chart is built around three primary dimensions — price, time, and volume.
- Price shows how much an asset is worth at a given moment.
- Time tracks when those price changes occur.
- Volume reflects how much of that asset is being traded — an indicator of market strength.
In 2025, most major crypto exchanges offer interactive charting interfaces powered by TradingView or similar platforms. These allow traders to analyze coins like Bitcoin (BTC), Ethereum (ETH), and Solana (SOL) using multiple timeframes — from 1-minute scalping charts to weekly and monthly trend analyses.
For long-term investors, weekly and monthly charts highlight macro trends. For day traders, shorter timeframes reveal entry and exit opportunities. Knowing how to switch between these views is the first step to mastering any crypto chart.
The Candlestick: The Language of Market Emotion
If you want to understand market sentiment at a glance, candlestick charts are your best friend. Each candlestick represents price movement within a specific time period — and carries critical information:
- Open: The price when the candle started.
- Close: The price when the candle ended.
- High and Low: The highest and lowest points reached in that period.
A green (or white) candle shows the price rose during that period, while a red (or black) one means it fell.
But candlesticks are more than just data; they reflect trader psychology. For instance:
- A Doji candle — where open and close prices are nearly identical — signals indecision.
- A Hammer pattern suggests potential bullish reversal after a downtrend.
- A Shooting Star hints at a bearish reversal after a rally.
In 2025, AI-driven trading bots increasingly rely on candlestick recognition algorithms to predict short-term market moves. Human traders who understand these patterns can often anticipate the same signals — before algorithms react.
Technical Indicators: Seeing Beyond the Surface
Reading a crypto chart isn’t just about recognizing shapes. It’s also about interpreting technical indicators — mathematical formulas applied to price data to reveal trends, momentum, and potential reversals.
Here are a few of the most essential indicators in 2025:
- Relative Strength Index (RSI): Measures whether a coin is overbought or oversold. An RSI above 70 may signal a coming pullback, while below 30 suggests a rebound.
- Moving Average Convergence Divergence (MACD): Shows trend direction and momentum. A bullish crossover (MACD line crossing above the signal line) can mean upward momentum is building.
- Bollinger Bands: These measure volatility. When price nears the upper band, the market might be overextended; near the lower band, it might be undervalued.
- Volume Oscillators: Rising volume confirms strong trends; falling volume can indicate weakening moves or false breakouts.
By combining indicators, traders can form a “multi-layered” view of the market — one that goes beyond price action to capture deeper sentiment.
Reading Trends: Support, Resistance, and Breakouts
One of the most critical skills when reading a crypto chart is identifying support and resistance levels.
- Support is the price level where demand is strong enough to stop a decline.
- Resistance is where selling pressure prevents further upward movement.
When a coin repeatedly bounces off a support level, it signals strong buyer interest. When it breaks above resistance — often confirmed by volume — it can mark the start of a bullish breakout.
In 2025, breakout trading remains a dominant strategy, but traders increasingly use automated alerts and AI-based pattern recognition to identify these moments early. Still, human intuition and experience remain unmatched when it comes to confirming whether a breakout is genuine or a fakeout.
Adapting to Market Conditions in 2025 and 2026
The crypto landscape of 2025–2026 is far more complex than just Bitcoin and Ethereum charts. Layer-1 blockchains, tokenized real-world assets, and decentralized finance (DeFi) protocols have introduced new market variables.
Moreover, AI-powered trading bots and predictive analytics are reshaping how price movements occur — often making markets react faster and more violently to major events.
This makes reading charts not just a matter of pattern recognition but of context. For example, a breakout on a low-volume token might not mean much without corresponding news or blockchain activity to back it up.
Smart traders in 2025 combine technical and fundamental analysis: they read charts to time entries, but also follow on-chain data, project updates, and macroeconomic trends to validate their decisions.
Common Mistakes When Reading Crypto Charts
Even as tools improve, many beginners fall into predictable traps when reading crypto charts:
- Over-relying on indicators: Using too many signals can lead to confusion or “analysis paralysis.”
- Ignoring volume: Price moves without strong volume often fail to hold.
- Chasing trends: Entering trades after a big move often means buying tops or selling bottoms.
- Forgetting fundamentals: Charts show patterns, not purpose — always understand the project or news behind a coin.
In 2026, as markets mature and regulation tightens, disciplined chart reading — grounded in risk management — will separate serious traders from speculators.
Conclusion: Turning Charts Into Strategy
Learning how to read a crypto price chart isn’t just about technical skill — it’s about developing market intuition. In 2025 and 2026, the most successful traders are those who combine data-driven analysis with emotional discipline and a long-term perspective.
Charts reveal opportunities, but only if you can interpret them within the larger story of crypto evolution — from Bitcoin halving cycles to global adoption trends.
Mastering chart reading empowers you to act, not react. Whether you’re managing a diversified portfolio or trading daily, understanding the signals behind the candles can turn uncertainty into confidence — and volatility into opportunity.