Key Takeaways
- A crypto price chart reveals market trends, sentiment, and volatility — essential for informed trading in 2025.
- Learn to read candlesticks, support/resistance, and indicators like RSI and MACD to spot real momentum.
- Combining AI tools with chart literacy offers a competitive edge in the evolving crypto markets of 2025–2026.
How to Read a Crypto Price Chart: A Complete 2025 Guide for Smarter Trading
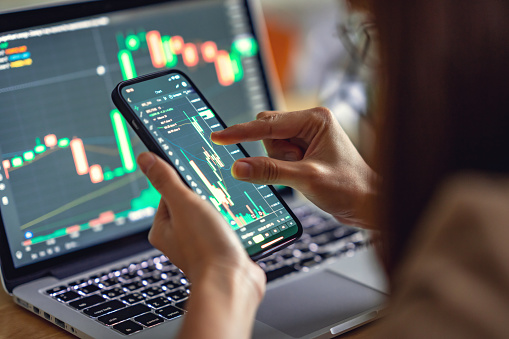
In the fast-moving world of digital assets, knowing how to read a crypto price chart is no longer a skill reserved for professional traders — it’s essential for anyone navigating the crypto markets of 2025.
Whether you’re investing in Bitcoin, Ethereum, or new altcoins, understanding price charts helps you see what the numbers are actually telling you: when momentum is building, when volatility is peaking, and when it might be time to act — or wait.
As cryptocurrencies mature and institutional traders join the field, chart literacy has become a critical edge. This guide explains, in clear terms, how to interpret crypto charts like a pro — without the jargon or confusion.
Understanding the Basics: What a Crypto Price Chart Shows
At its core, a crypto price chart visualizes how an asset’s price has changed over time. It helps traders and investors make informed decisions based on historical trends and real-time movements.
The most common chart type is the candlestick chart, which displays price movement within a specific time frame — from one minute to one week or more. Each “candlestick” contains four data points:
- Open: The price when the time period began.
- Close: The price when the time period ended.
- High: The highest price reached during the period.
- Low: The lowest price reached during the period.
If the candle is green, the closing price was higher than the opening (a gain). If it’s red, the price fell.
Candlestick charts are used because they show emotion and volatility — the story behind each move. In a market driven by sentiment and speed, that matters.
Also read : Top 10 Crypto YouTubers to Learn From
Key Chart Components Every Trader Should Know
To understand how to read a crypto price chart effectively, you need to know more than just the colors and lines. Here are the fundamental elements that drive technical analysis in 2025:
1. Time Frames
Crypto markets operate 24/7, meaning price data never stops updating. Short-term traders may look at 5-minute or hourly charts, while long-term investors focus on daily, weekly, or monthly views.
Choosing the right time frame helps you filter noise from narrative — identifying genuine trends rather than momentary spikes.
2. Volume
Volume shows how much of a coin is being traded in a given period. Rising volume during a price move confirms strong momentum; low volume often signals weak conviction.
For instance, a breakout in Bitcoin’s price with high volume usually indicates real buying interest, while a spike on low volume may fade quickly.
3. Support and Resistance Levels
These are horizontal zones on the chart where price tends to pause, bounce, or reverse.
- Support is the price level where buyers consistently step in.
- Resistance is where sellers dominate, preventing further upward movement.
Recognizing these zones helps traders anticipate entry and exit points, especially in volatile 2025 markets where AI-driven trading bots amplify short-term reactions.
4. Trend Lines and Channels
A trend line connects a series of highs or lows, helping identify whether an asset is in an uptrend (bullish) or downtrend (bearish).
When price stays within parallel trend lines, it forms a channel — a useful guide for traders managing risk and timing trades.
Moving Averages and Indicators: The Trader’s Toolkit
While charts reveal price action, indicators reveal momentum, trend strength, and potential reversals. The most widely used indicators in crypto markets remain consistent heading into 2025, though increasingly powered by AI analytics and algorithmic forecasts.
Moving Averages (MA)
A moving average smooths out price data to show the average value over a set number of periods — such as 50-day or 200-day averages.
When the short-term MA (e.g., 50-day) crosses above the long-term MA (200-day), it’s often seen as a bullish signal, known as the Golden Cross. The opposite (the Death Cross) indicates possible bearish momentum.
Relative Strength Index (RSI)
RSI measures the speed and magnitude of recent price changes to determine overbought or oversold conditions.
- Above 70 → overbought (possible pullback).
- Below 30 → oversold (potential rebound).
RSI helps traders spot momentum shifts before they show up in price action.
MACD (Moving Average Convergence Divergence)
The MACD indicator tracks the relationship between two moving averages, highlighting trend direction and momentum. When the MACD line crosses above the signal line, it suggests bullish momentum; crossing below signals potential weakness.
By combining these indicators, traders can confirm whether a trend is gaining or losing strength — crucial for timing entries and exits in a fast-paced crypto environment.
How to Read Market Sentiment Through Charts
Crypto trading is as much about psychology as it is about math. Every candle and spike represents thousands of decisions made by traders reacting to fear, greed, or global news.
Charts visualize this collective behavior:
- Sharp green candles often indicate FOMO (fear of missing out) buying.
- Long red candles may reveal panic selling or liquidation events.
- Sideways consolidation often signals indecision before a breakout.
In 2025, sentiment analysis tools — powered by on-chain data and social metrics — are increasingly being integrated into charting platforms like TradingView, CoinMarketCap, and Binance Terminal. These tools merge human behavior with data science, giving traders a fuller picture of market dynamics.
Avoiding Common Mistakes When Reading Crypto Charts
Even seasoned traders misread charts when emotion or bias gets in the way. Here are common pitfalls to avoid:
- Overreliance on indicators: No single metric predicts price perfectly. Combine technicals with fundamentals and news context.
- Ignoring broader time frames: Zooming out often reveals the true direction of a trend.
- Chasing short-term patterns: Crypto is volatile — not every price swing means a reversal or breakout.
- Neglecting risk management: Even a perfect chart setup can fail. Always set stop-losses and avoid overleveraging.
Reading Charts in 2025: The AI and Data Advantage
By 2025, crypto analytics has evolved beyond manual chart reading. Machine learning models now analyze historical chart data, blockchain activity, and sentiment trends to provide predictive insights.
Still, while AI tools can suggest probabilities, human judgment remains critical. Understanding the fundamentals of chart reading ensures you can interpret AI signals intelligently — not blindly follow them.
Many successful traders in 2025 blend traditional chart analysis with AI-backed predictions, using both intuition and technology to stay ahead in the market.
Conclusion: Chart Literacy Is Crypto Literacy
Knowing how to read a crypto price chart is like learning a new language — one that translates market noise into meaningful patterns.
In a year where volatility, institutional flows, and AI-driven trading dominate, this skill separates informed participants from emotional speculators.
Whether you’re holding Bitcoin long-term or trading emerging tokens, chart literacy empowers you to make smarter, more confident decisions — grounded in data, not hype.
The best traders of 2025 aren’t those who predict every move — they’re the ones who understand what the charts are really saying.