3 Short Key Takeaways
- Learning how to read a crypto price chart in 2025–26 helps investors spot trends, manage risk, and avoid emotional trading.
- Focus on key tools like candlesticks, moving averages, RSI, and volume — and verify with on-chain data.
- Charts don’t predict the future, but they reveal the story of market psychology and help you trade with confidence.
How to Read a Crypto Price Chart in 2025–26: A Smart Investor’s Guide
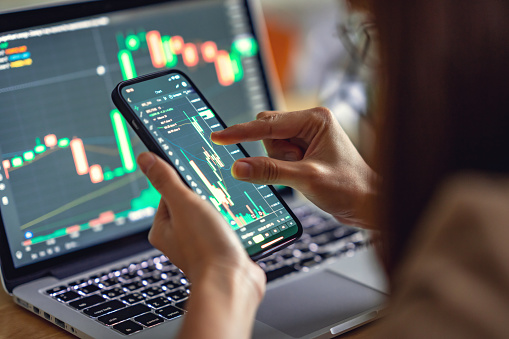
In 2025, the cryptocurrency market is more complex, data-driven, and transparent than ever before. For both new and seasoned investors, learning how to read a crypto price chart has become an essential skill — not just for trading, but for understanding market sentiment, timing entries, and spotting trends before they make headlines.
With Bitcoin’s price cycles maturing, AI-driven trading tools entering the mainstream, and on-chain analytics becoming public, the way we interpret charts in 2025 and 2026 is evolving. Gone are the days when looking at a simple line graph was enough. Today’s crypto investors rely on candlestick patterns, moving averages, and trading volume — all layered with real-time blockchain data.
So, if you want to build confidence and cut through noise in this fast-moving market, it’s time to learn the language of charts — the visual heartbeat of crypto.
Understanding the Basics: What a Crypto Price Chart Really Shows
At its core, a crypto price chart is a visual record of how a digital asset’s price has moved over time. But beyond that simplicity lies a data-rich map of trader psychology — showing fear, greed, hesitation, and conviction.
Price Action and Timeframes
Price charts plot the value of a cryptocurrency (like Bitcoin or Ethereum) against time. The timeframe you choose — from one minute to one month — changes what you see:
- Short-term charts reveal volatility and quick momentum shifts, useful for day traders.
- Long-term charts smooth out noise, helping long-term investors identify larger market cycles.
The Candlestick Advantage
By 2025, candlestick charts remain the global standard for traders. Each candlestick represents four key data points in a given time period:
- Open: where the price started
- Close: where it ended
- High: the highest price reached
- Low: the lowest price reached
A green (or white) candle signals upward movement; red (or black) shows a decline. When read together, these candles form recognizable patterns — like “bullish engulfing” or “shooting star” — that hint at market shifts before they’re visible in price.
Indicators Every 2025 Trader Should Know
Modern crypto price charts go far beyond simple visuals. With the integration of AI analytics and on-chain data, traders in 2025–26 have access to dozens of technical indicators that reveal momentum, strength, and potential reversals.
Moving Averages (MA and EMA)
A Moving Average (MA) smooths out price fluctuations, helping you see the underlying trend.
- The Simple Moving Average (SMA) is an average over a set number of days — for example, the 50-day or 200-day SMA.
- The Exponential Moving Average (EMA) gives more weight to recent prices, making it faster to react to new data.
When a short-term MA crosses above a long-term one (the “Golden Cross”), it can signal the start of a bullish trend — something crypto traders will watch closely in 2025’s volatile markets.
Relative Strength Index (RSI)
The RSI measures whether a coin is overbought or oversold on a scale of 0–100.
- RSI above 70 suggests overbought (potential sell signal).
- RSI below 30 suggests oversold (potential buy signal).
As markets become more algorithmically driven in 2025, RSI patterns can help humans detect emotional overreactions that bots might amplify.
Volume Analysis
Trading volume shows how much of a coin was bought or sold during a given period. A price rise backed by strong volume indicates conviction — while one with weak volume might signal a false breakout.
In 2026, on-chain data will likely enhance volume analysis further, combining exchange trades with blockchain transaction flows for greater transparency.
Reading Market Psychology Through Charts
Understanding how to read a crypto price chart also means interpreting human behavior. Even with advanced tools, markets are still driven by emotion — optimism, fear, greed, and uncertainty.
When a coin repeatedly hits resistance and fails to break higher, it reflects hesitation and potential sell pressure. Conversely, when buyers repeatedly step in at the same price level (support), it shows confidence.
Patterns like “double tops,” “head and shoulders,” or “ascending triangles” reveal crowd psychology in real time. The best traders in 2025 use these patterns alongside macro news — such as regulation shifts, ETF approvals, or network upgrades — to anticipate moves rather than react.
The 2025–26 Evolution: From Charts to Insights
The crypto charting tools of 2025 are not just visual—they’re interactive data ecosystems. Platforms now integrate:
- On-chain analytics: Wallet movements, whale tracking, and staking flows.
- AI predictions: Machine learning models trained on years of price data and social sentiment.
- Cross-market signals: Correlations between crypto, equities, and macroeconomic indicators like inflation or interest rates.
As institutional adoption rises, retail traders have access to the same data depth once reserved for hedge funds. Yet, the core principles remain timeless: understand the basics, confirm trends with indicators, and avoid emotional decisions.
Even in an age of automation, human judgment — interpreting narratives, regulation, and community sentiment — remains irreplaceable.
Avoiding Common Pitfalls
While charts can empower you, they can also mislead if misused. In 2025–26, common mistakes still include:
- Overreliance on one indicator: No single metric predicts markets accurately. Combine multiple signals.
- Ignoring timeframes: A bullish setup on a 15-minute chart might contradict the weekly trend.
- Emotional trading: Charts show data, not destiny. Stick to your plan, not your feelings.
The smartest investors treat price charts as decision tools, not prediction machines.
Conclusion: Mastering the Language of Crypto Charts
By 2025 and 2026, reading a crypto price chart is more than a technical exercise — it’s a strategic skill for navigating an increasingly data-driven financial world. Whether you’re managing your first Bitcoin position or trading AI tokens across exchanges, understanding how to interpret charts gives you an edge.
A chart tells a story — of buyers and sellers, fear and confidence, opportunity and risk. Learn to read it fluently, and you’ll gain the clarity needed to make rational decisions in an emotional market.
In a space defined by volatility, your best advantage is not predicting the future, but understanding the present — one candlestick at a time.